Purpose
The purpose of this web page is to provide viewers with a look into my spotify listening data. This page is for the select few that want to get the inside scoop of what I've been listening to in the recent past, and more specifically what artists I've been jamming out to
Sub-Genre of Data
While music data is a large genre, this web page focuses specifically on my (Maia Rocha's) music data. And to be even more specific, this webpage displays my listening data of my top artists within the very recent past, ie like four weeks
Spotify for Developers can help you gain your data in its almost rawest form: .json . As seen below, once your credentials are certified (you sign in) you can call the Spotify API directly from the Spotify for Developers web page and get back your listening data in accordance with the parameters you input. This form of the data would be best for those looking to scrutinize certain data points as the .json file returned includes a lot of extra data like the artist populatiry and genre
Spotify for Developers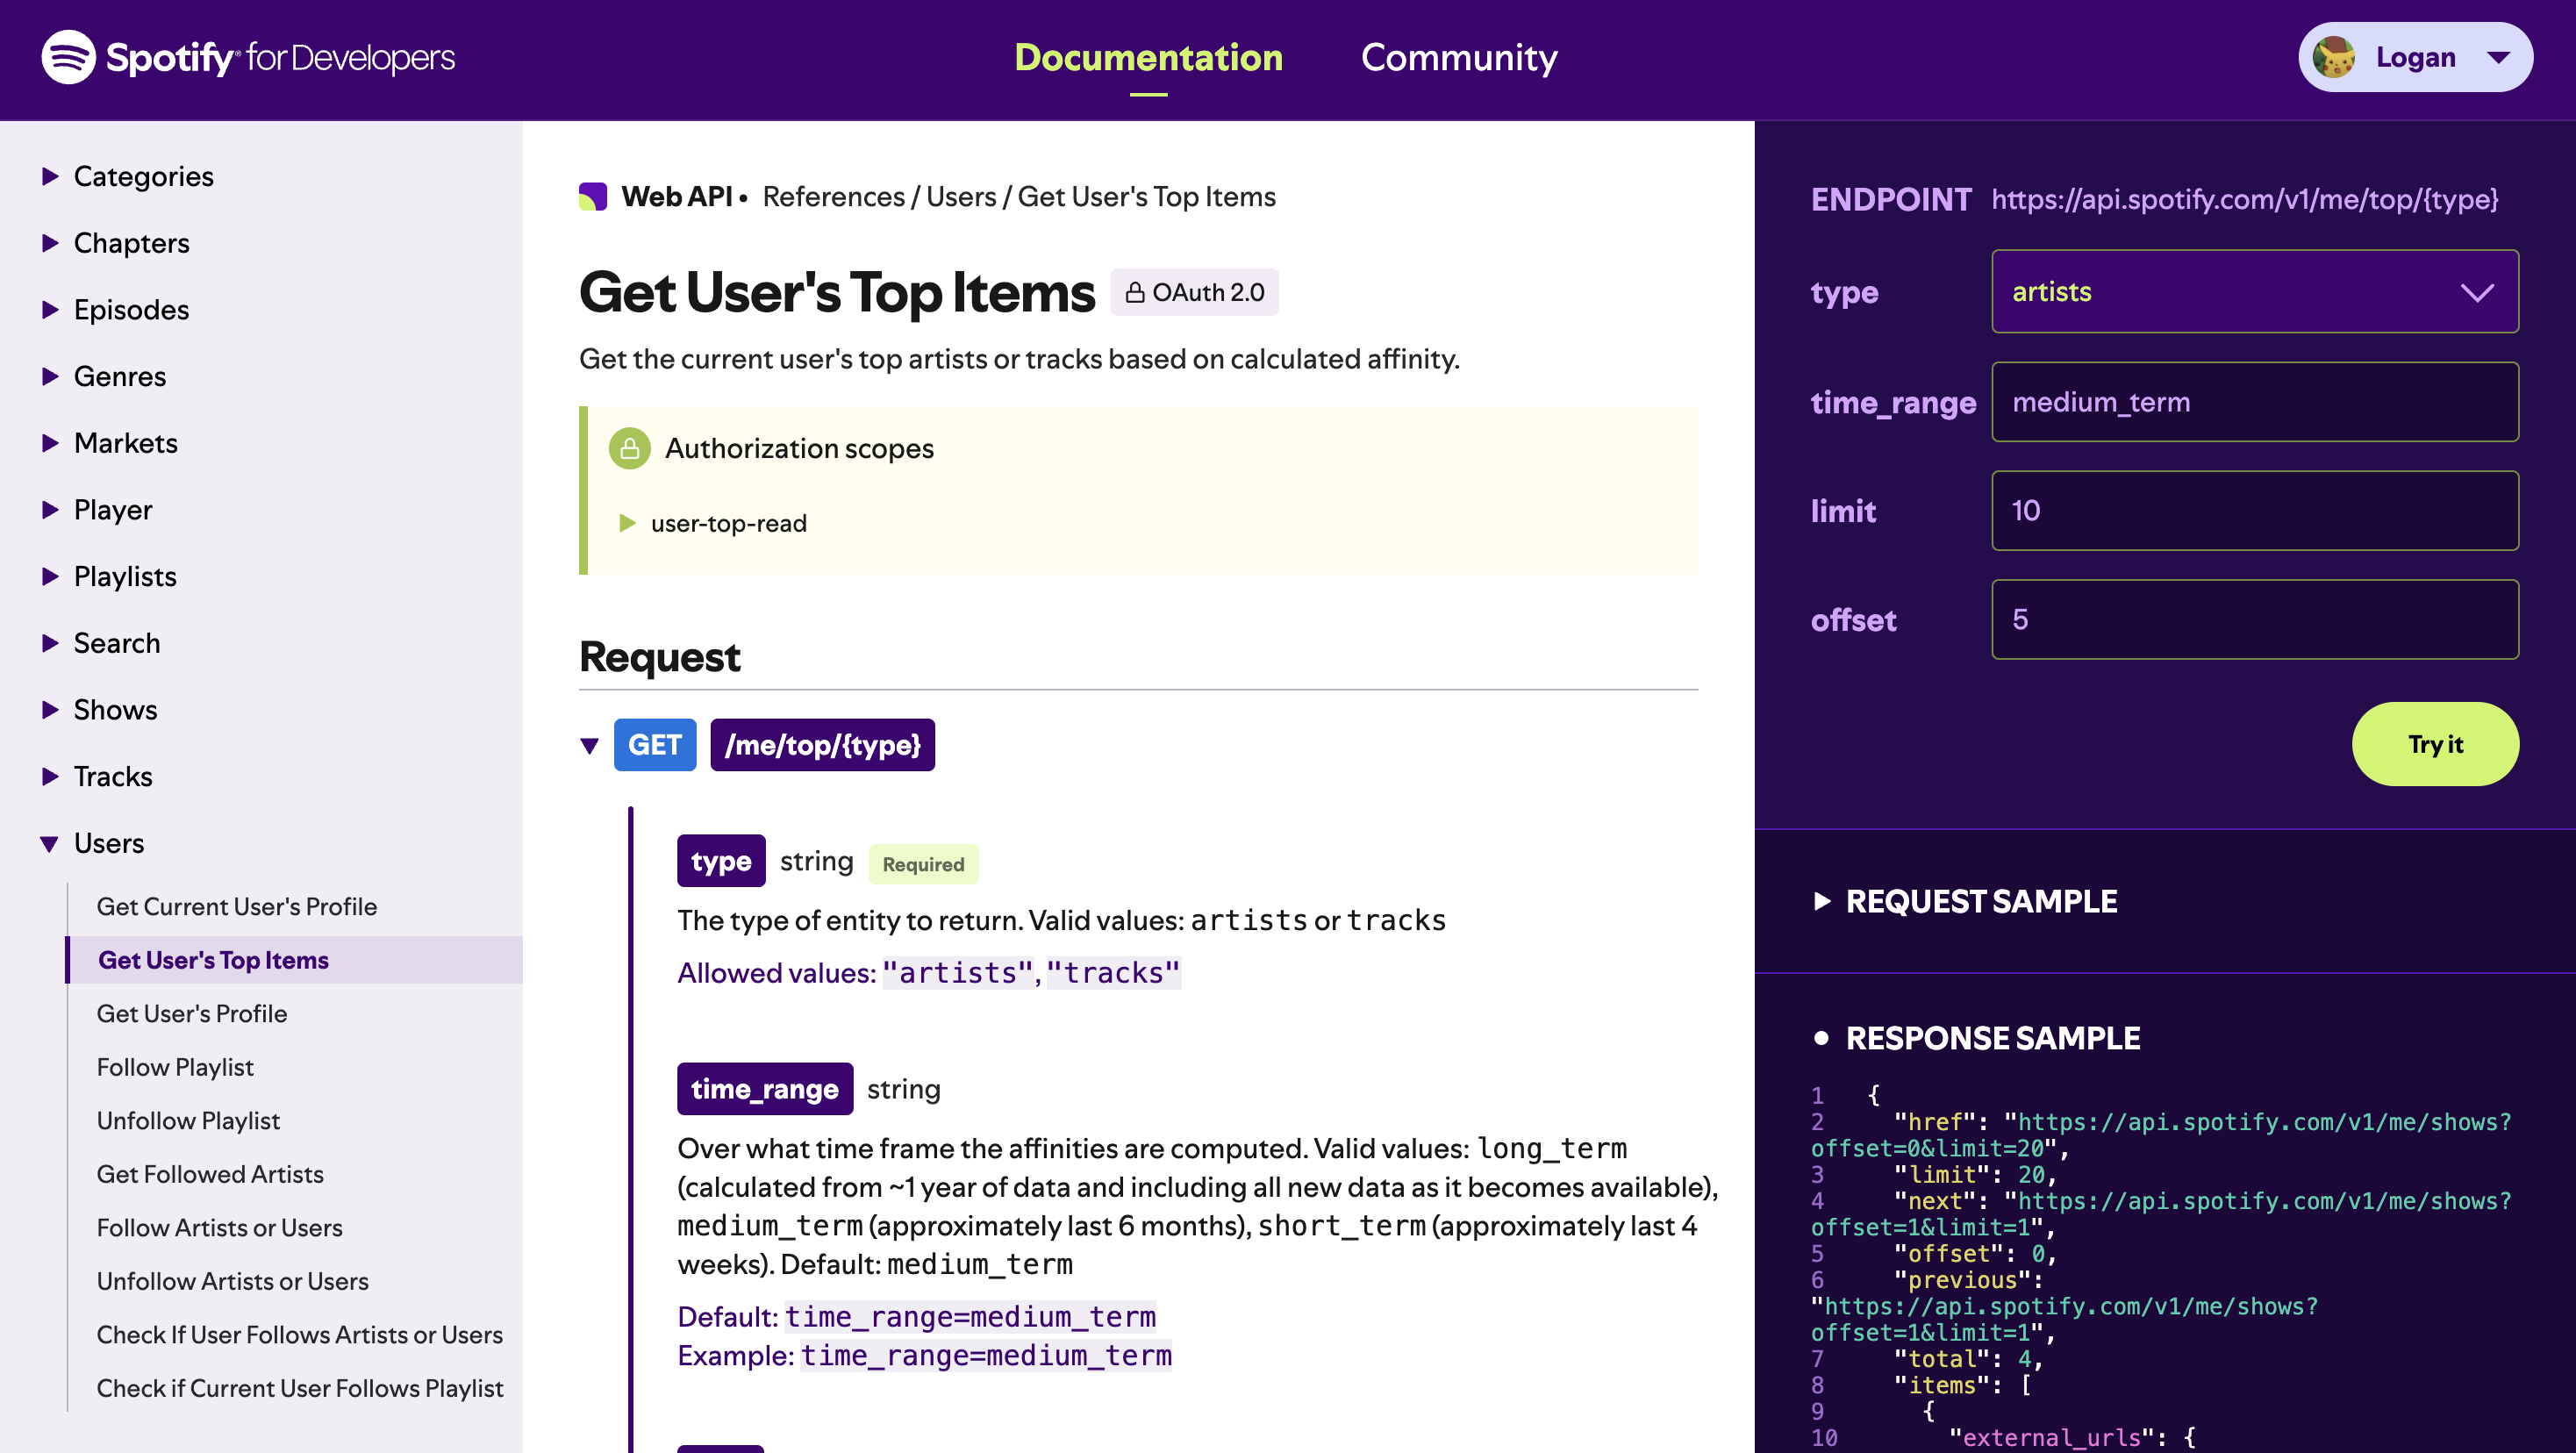
Stats for Spotify provides your data in a more digestible manner, with a visualized leaderboard in grid format. This way you dont have to parse through your raw listening data to view who your listeneing most to. This form of data is best for those who want to continually keep track of their listening habbits without getting into the nitty gritty details. With this format, viewers can easily visualize their listening trends over time, making it easier to analyze their own prefrences.
Stats for Spotify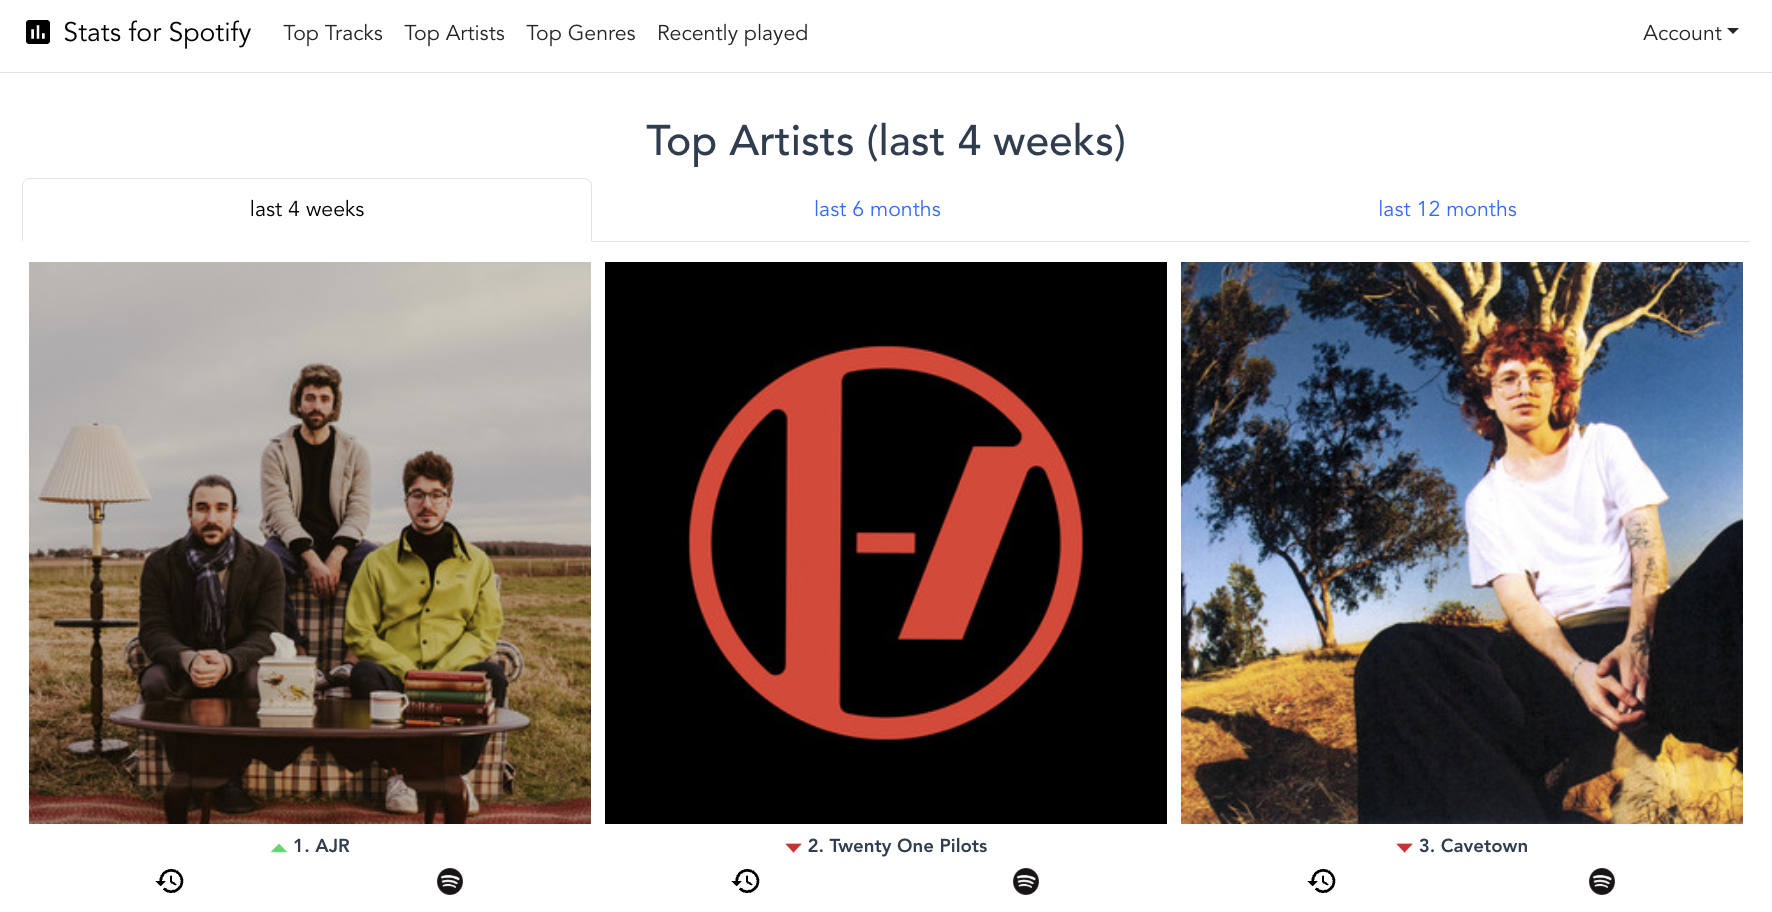
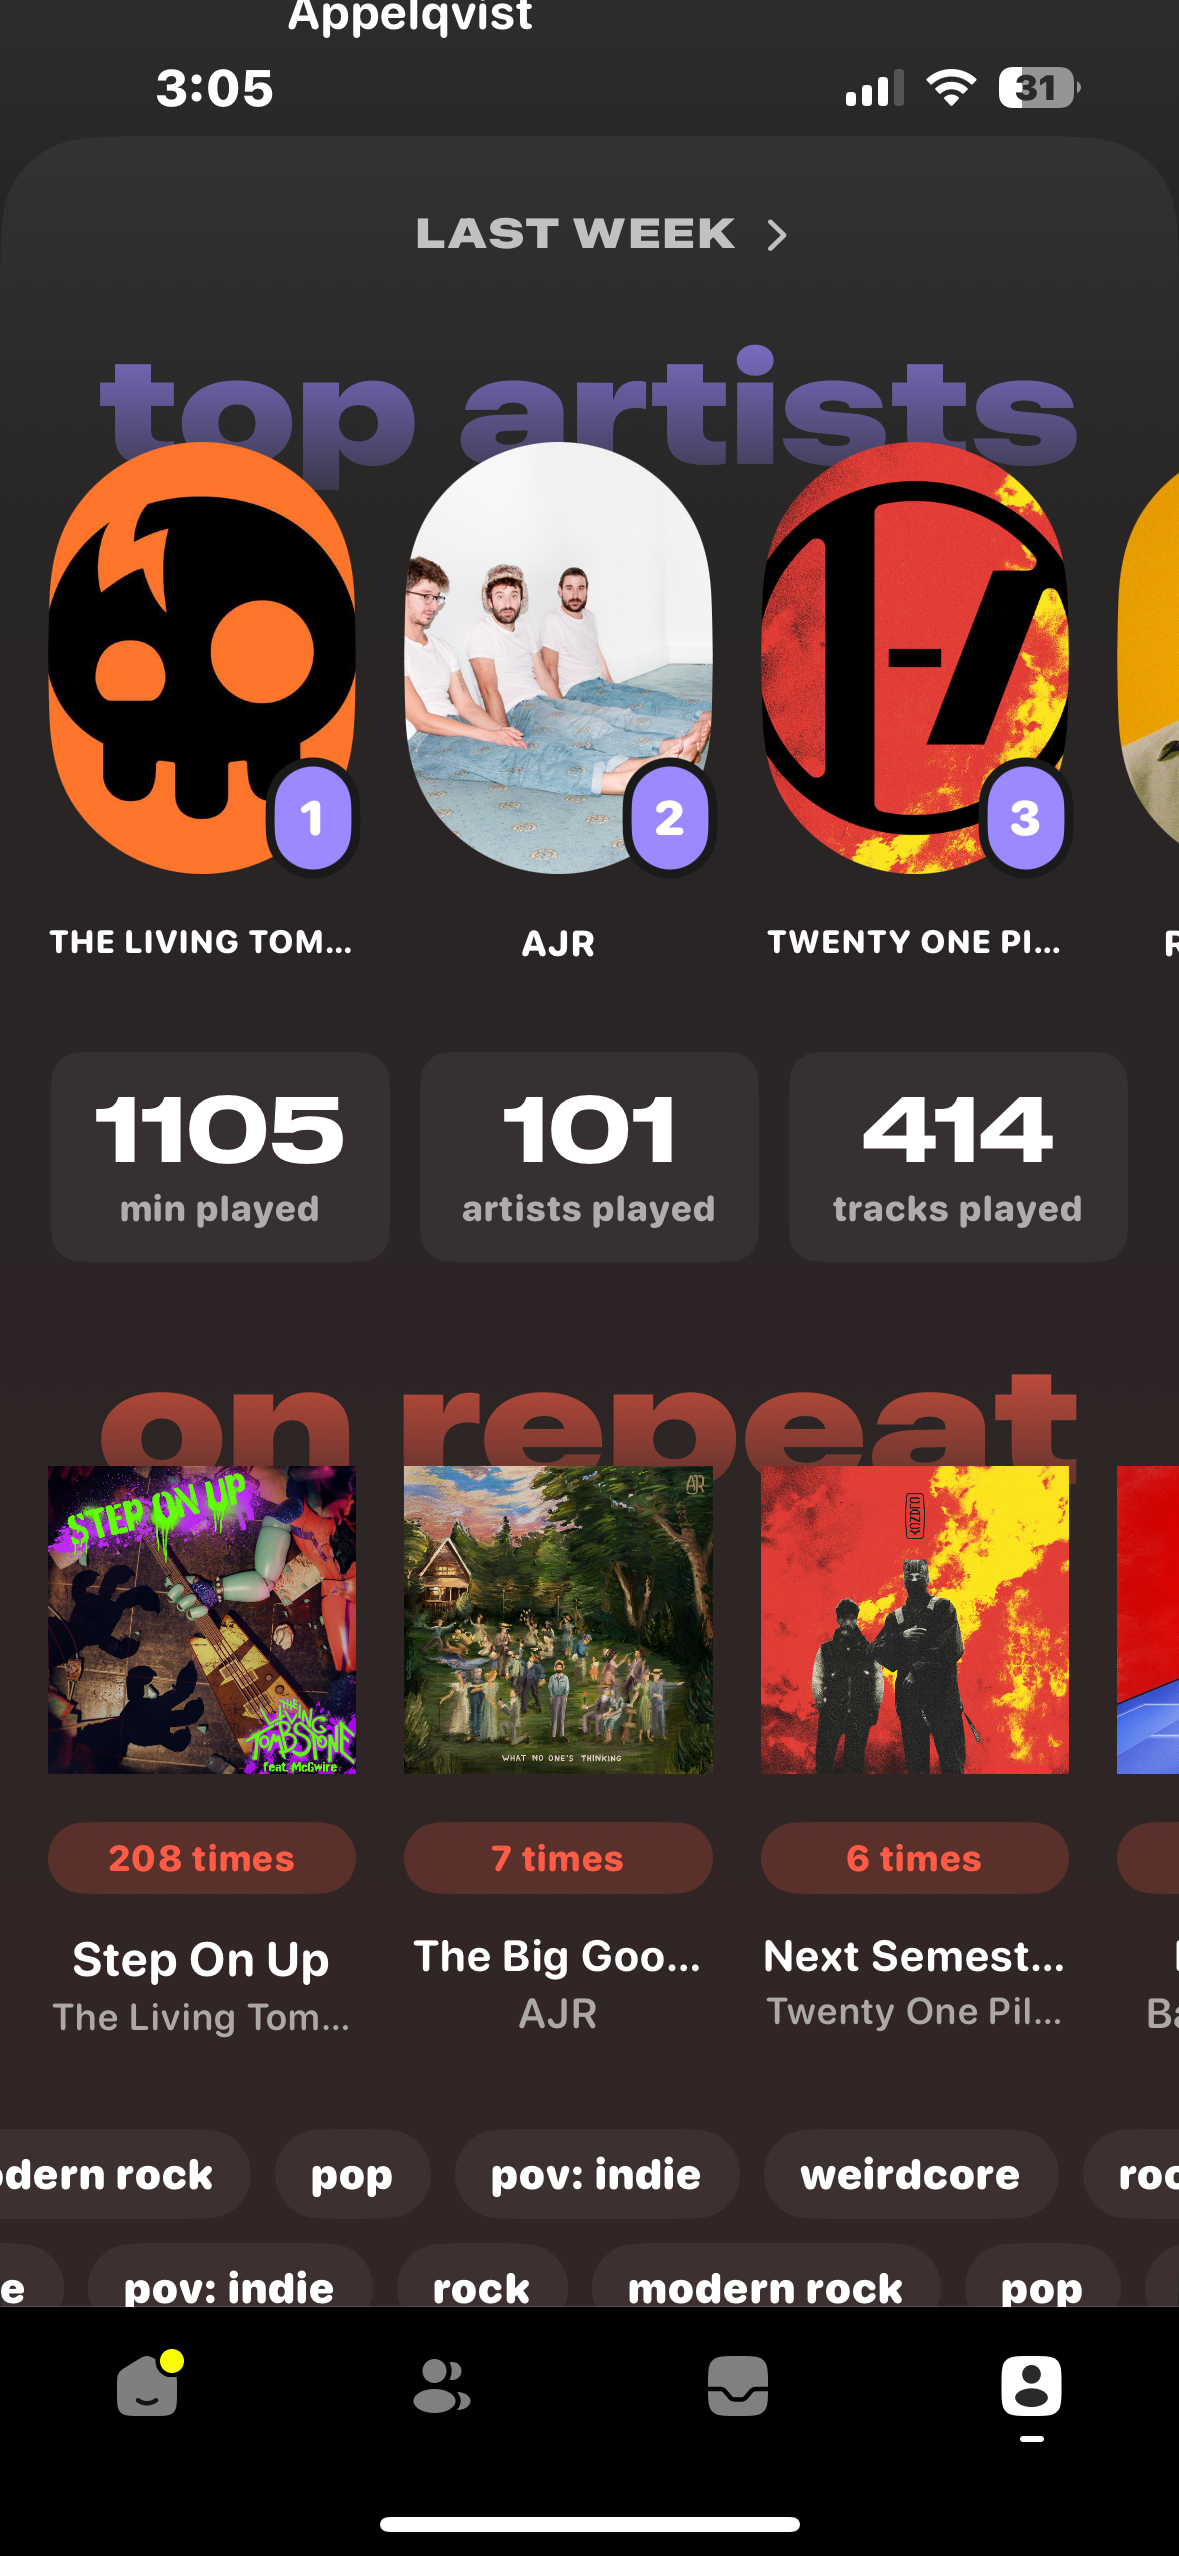
AirBuds
AirBuds displays data even more digestibally. By displaying top artist in a scroll rather than grid layout, it can display yet more data than stats for spotify. In the screenshot shown to the right, you can see other datapoints usch as minutes played, tracks played, repeat counts, and more. Listeners can gain far more insight into their listening habits from AirBuds than stats for spotify because it visualizes more datapoints, and because of this, listeners may prefere to use airbuds over stats for spotify.
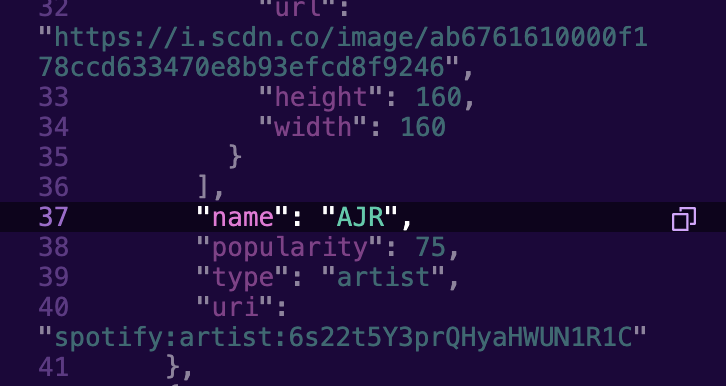

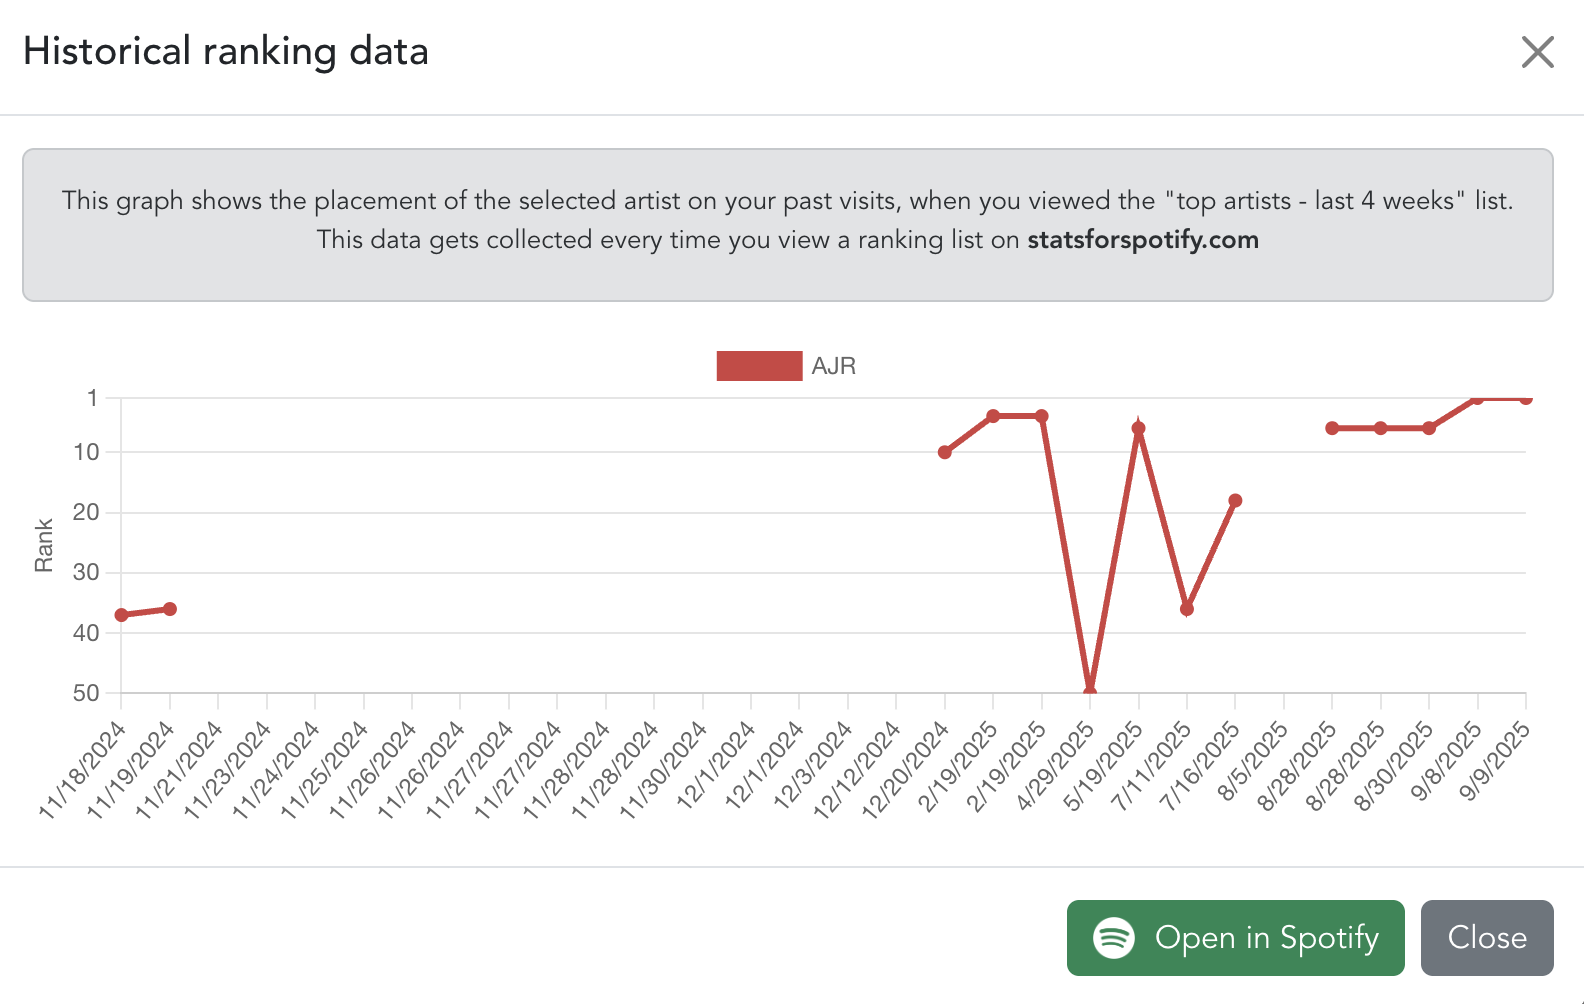
Each site offers a distinct insight on the users listening habbits. Lets walk through them together. The first insight we get is from Spotify for developers in its raw .json format. Highlighted is the name of my top artist for the last 4 weeks, AJR. Along with the artist name, however, we get bits of metadata associated with the artists such as their popularity score, their logo image, and their spotify uri. This format could be good for developers looking to leaverage this data in their own projects. The next sinsight we get is on the right from stats for spotify. The chart displays my listening habbits of ARJ over time. Here the viewer, and me, can more visually digest how sporatically my AJR listeneing has been, going from very frequent to very infrequent several times. The final insight we can gain is from airbuds, as shown with the last screenshot all the way to the right. Highlighted is AJR, and surpisingly not in first place as Stats for Spotify and Spotify for Developers shows. That is becuase airbuds displays the top artists every week rather than last 4 weeks. This gives us an even more precise look into my current listening habbits, pinpoining the exact top artists over weekly listening trends. All of these forms of data are uesful to understanding my, or anyones, listening habbits. Some are more in depth than others and some are more digestible than others. I beleive that airbuds is the perfect blend of in depth and visually digestible, while spotify for developers is perfect for VERY in depth data and stats for spotify is best for simple digestible listening trends.
Spotify for Developers top artist metadata |
Stats for Spotify Top Artist listening trend over time |
AirBuds Top Artist detailed listening data